Page 428 - FRUTAS DEL TRÓPICO
P. 428

428                                      Frutas del trópico


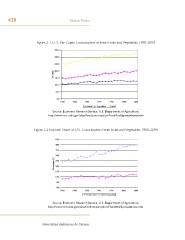
                         Figure 2.1 U. S. Per Capita Consumption of Fresh Fruits and Vegetables 1980-2004

                                     350.0

                                     300.0

                                     250.0

                                    Lbs/capita  200.0

                                     150.0
                                     100.0

                                      50.0

                                       0.0
                                         1980    1984    1988    1992    1996     2000    2004
                                                           Fruits  Vegetables  Total
                                    Source: Economic Research Service, U.S. Department of Agriculture.
                                 http://www.ers.usda.gov/data/foodconsumption/FoodAvailSpreadsheets.htm


                        Figure 2.2 Imports’ Share of U.S. Consumption Fresh Fruits and Vegetables 1980-2004


                                      45%
                                      40%
                                      35%

                                      30%
                                     Percentage (%)  25%

                                      20%
                                      15%
                                      10%
                                      5%

                                      0%
                                         1980    1984    1988    1992    1996    2000     2004
                                                          Fresh Fruits  Fresh Vegetables

                                    Source: Economic Research Service, U.S. Department of Agriculture.
                                 http://www.ers.usda.gov/data/foodconsumption/FoodAvailSpreadsheets.htm.


                             Universidad Autónoma de Chiapas
   423   424   425   426   427   428   429   430   431   432   433