
Page 427 - FRUTAS DEL TRÓPICO
P. 427
427
the maRket foR impoRted fResh fRuits and vegetables in the united states
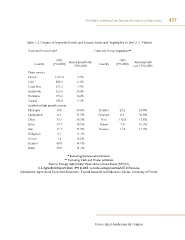
Table 1.2 Origins of Imported Fresh and Frozen Fruits and Vegetables to the U.S. Market
Fresh and Frozen Fruits* Fresh and Frozen Vegetables**
2005 2005
Country (MTx000) Annual growth rate Country (MTx000) Annual growth
1990-2005 rate 1990-2005
Major sources
Mexico 1,423.3 4.2%
Chile 842.5 2.3%
Costa Rica 611.3 7.9%
Guatemala 255.6 8.6%
Honduras 195.6 4.6%
Canada 142.0 1.5%
Smaller but high growth sources
Nicaragua 10.5 39.6% Ecuador 29.2 24.8%
Netherlands 0.4 33.7% Denmark 0.4 20.9%
China 23.2 28.7% Peru 126.8 17.8%
Belize 27.7 18.5% Poland 7.0 16.3%
Italy 11.7 17.9% Panama 11.4 12.9%
Philippines 2.1 17.7%
Greece 1.5 16.5%
Ecuador 68.0 14.1%
Brazil 39.0 13.7%
* Excluding bananas and plantains.
** Excluding fresh and frozen potatoes.
Source: Foreign Agricultural Trade of the United States (FATUS),
U.S. Agricultural Imports Data 1990 & 2005, www.fas.usda.gov/ustrade/USTImFatus.asp.
Calculations: Agricultural Economics Extension, Tropical Research and Education Center, University of Florida.
Universidad Autónoma de Chiapas