Page 426 - FRUTAS DEL TRÓPICO
P. 426

426                                      Frutas del trópico


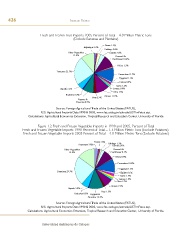
                            Fresh and Frozen Fruit Imports 2005 Percent of Total – 4.0 Million Metric Tons
                                                  (Exclude Bananas and Plantains)

                                                                       Beans 1.3%
                                                         Asparagus 1.3%
                                                                       Cabbage 2.6%
                                               Other Vegetables           Carrots 3.8%
                                                 11.0%                        Broccoli &
                                                                           Cauliflower 10.4%
                                                                               Celery 1.2%

                                       Tomatoes 23.7%
                                                                                Cucumbers 11.7%
                                                                                 Eggplant 1.1%
                                                                                 Endive 0.2%
                                                                              Garlic 1.2%
                                          Squash 5.1%                       Lettuce 0.9%
                                                                             Okra 1.2%
                                             Radishes 0.7%             Onions 11.2%
                                                               Peas 2.5%
                                                     Peppers &
                                                   Pimentos 8.9%
                                      Source: Foreign Agricultural Trade of the United States (FATUS),
                            U.S. Agricultural Imports Data 1990 & 2005, www.fas.usda.gov/ustrade/USTImFatus.asp.
                    Calculations: Agricultural Economics Extension, Tropical Research and Education Center, University of Florida


                          Figure 1.2 Fresh and Frozen Vegetable Imports in 1990 and 2005, Percent of Total
                Fresh and Frozen Vegetable Imports 1990 Percent of Total – 1.5 Million Metric Tons (Exclude Potatoes).
                Fresh and Frozen Vegetable Imports 2005 Percent of Total – 4.0 Million Metric Tons (Exclude Potatoes)

                                                                Beans 1.6%
                                                     Asparagus 2.8%      Cabbage 1.3%
                                                                            Carrots 2.4%
                                            Other Vegetables                 Broccoli &
                                               14.9%                      Cauliflower 8.3%
                                                                              Celery 0.7%

                                                                               Cucumbers 10.8%
                                                                                 Eggplant 1.3%
                                       Tomatoes 23.7%                            Endive 0.1%
                                                                                 Garlic 1.7%
                                                                                Lettuce 1.9%
                                                                               Okra 1.3%
                                                                           Onions 7.3%
                                               Squash 5.9%
                                                                     Peas 1.5%
                                                   Radishes 0.5%   Peppers &
                                                           Pimentos 12.2%
                                      Source: Foreign Agricultural Trade of the United States (FATUS),
                            U.S. Agricultural Imports Data 1990 & 2005, www.fas.usda.gov/ustrade/USTImFatus.asp.
                   Calculations: Agricultural Economics Extension, Tropical Research and Education Center,  University of Florida.


                             Universidad Autónoma de Chiapas
   421   422   423   424   425   426   427   428   429   430   431